

Apple 26 September 2026 quarter — headline results
Apple reported $114.5 billion in net sales for the quarter ended 26 September 2026, up roughly 12% year‑over‑year, driven by stronger iPhone demand and record services revenue. Net income reached $30.7 billion, a 12% increase year‑over‑year, and diluted earnings per share rose to $2.10 from $1.85. These figures reflect higher unit and price mix for flagship devices and expanding recurring revenue from subscriptions and digital storefronts.
How product groups contributed to the quarter
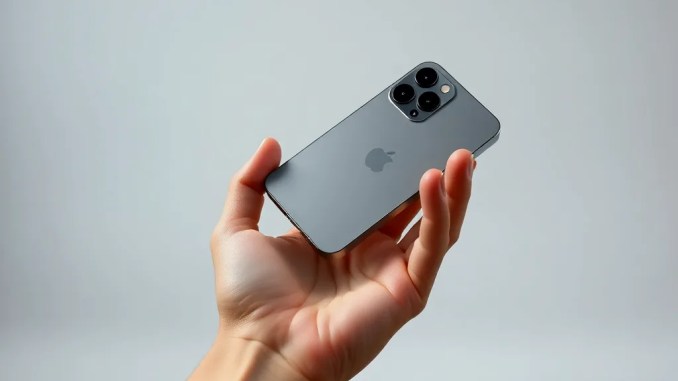
iPhone: iPhone revenue totaled $57.6 billion, up 17.5% year‑over‑year. That increase came from a combination of model cycle timing, higher average selling prices in key markets, and promotional programs that moved earlier adopter purchases forward. Apple’s geographic shift toward stronger growth in Asia and services‑integrated offerings also bolstered iPhone ASPs.
Mac: Mac revenue grew 23.7% to $10.8 billion. The rise reflects refreshed silicon‑based models and uptake in education and enterprise deployment. Corporate refresh cycles, remote/hybrid work requirements, and stronger channel inventory replenishment all supported this segment.
iPad: iPad revenue fell 10.4% to $6.2 billion. The decline likely stems from a longer replacement cycle, competition in lower price tiers, and timing differences in commercial purchases. Apple may need targeted product or pricing moves to reaccelerate this category.
Services: Services generated $31.6 billion, roughly a 10% increase. Subscription growth (Apple Music, iCloud, Apple TV+, Apple One), App Store ecosystem monetization, and enterprise cloud partnerships explain the sustained expansion. Services now represent a larger portion of gross margin because of higher recurring revenue and lower incremental cost per user.
Full fiscal year 2026 performance and material trends
Fiscal 2026 net sales rose to $478.8 billion, a 15% increase year‑over‑year, and net income reached $132.2 billion, up 18%. Annual iPhone revenue hit $254.1 billion while Mac and iPad totaled $37.9 billion and $27.9 billion, respectively. Services produced $123.3 billion for the year, highlighting the company’s shift toward less cyclical revenue sources.
Why iPhone reached a quarterly record and what sustained it
Apple hit a quarterly iPhone record through coordinated product launches, regional pricing tactics, and ecosystem lock‑in. New model features attracted upgraders, while financing and trade‑in programs expanded affordability. Operationally, inventory timing and prioritized component sourcing for high‑margin models maintained availability where demand was strongest. The record reflects demand elasticity for flagship devices paired with higher attach rates for services and accessories.
Services: the margin stabilizer and growth engine
Services growth matters because it scales margins: incremental revenue from subscriptions and digital sales costs Apple far less than hardware. Examples: a $10 monthly subscription per user adds predictable revenue without proportional fulfillment costs; App Store fees and cloud services add high‑margin cash flow. For investors, monitoring monthly active users, ARPU (average revenue per user), churn rates, and new bundle penetration paints the clearest picture of services sustainability.
Detailed numbers at a glance
Quarter (26 Sep 2026) etc. prior year:
• Total net sales: $114.5B (+12%)
• Net income: $30.7B (+12%)
• iPhone: $57.6B (+17.5%)
• Mac: $10.8B (+23.7%)
• iPad: $6.2B (‑10.4%)
• Services: $31.6B (~+10%)
• Fiscal year net sales: $478.8B (+15%)
• Fiscal year net income: $132.2B (+18%)
Interpretation for investors and decision points to monitor
Investors should focus on four forward‑looking indicators rather than isolated headlines:
1) iPhone replacement cadence and ASP trends: Track unit sell‑through and ASP by region to see if premium demand persists or if pressure moves to mid/low tiers.
2) Services ARPU and churn: Rising ARPU with stable or falling churn signals durable recurring revenue growth; watch bundling adoption and regional penetration rates.
3) iPad product cycle and channel inventory: Determine whether the iPad decline reflects demand weakness or simply channel destocking; vendor sell‑in versus sell‑through data will clarify timing for a rebound.
4) Macro and FX exposure: Currency fluctuations and consumer discretionary cycles affect international revenue. Monitor hedging disclosures and revenue regional splits for sensitivity.
Practical examples and short scenarios investors can run
Scenario A (Bullish): iPhone ASPs hold and services ARPU grows 8% next year. That combination adds high‑margin revenue and expands operating margin even with modest hardware growth.
Scenario B (Caution): iPad softness broadens and iPhone units plateau while ASPs compress. Revenue growth slows and the company relies more heavily on services; margin expansion stalls if services growth decelerates.
Use sensitivity checks: model 2–4% ASP movement on iPhone and +/-10% services growth to see impact on operating income; that range often explains majority of near‑term EPS variance.
What Apple needs to do next to sustain growth
To sustain momentum, Apple should prioritize: targeted feature refreshes and pricing options for iPad, continued improvement in services discoverability and bundling, and regional go‑to‑market adaptations where replacement cycles lag. Operationally, keeping supply aligned with demand for premium devices and refining promotional cadence to avoid margin erosion will matter most.
Quick checklist for monitoring upcoming quarters
• Quarterly iPhone revenue and unit sell‑through by geography
• Services revenue growth rate and ARPU trends
• Gross margin and operating margin swings
• Channel inventory commentary in management discussion
• Currency impact and supply chain cost disclosures
Bottom line
Apple’s quarter finished 26 September 2026 shows resilient core device demand and accelerating high‑margin services revenue. The company recorded meaningful fiscal‑year gains, but iPad softness and external macro/FX pressures remain watch points. Investors should prioritize metrics tied to ASP, services ARPU, and channel dynamics to judge whether this quarter represents durable improvement or a cyclical bump.








Be the first to comment