
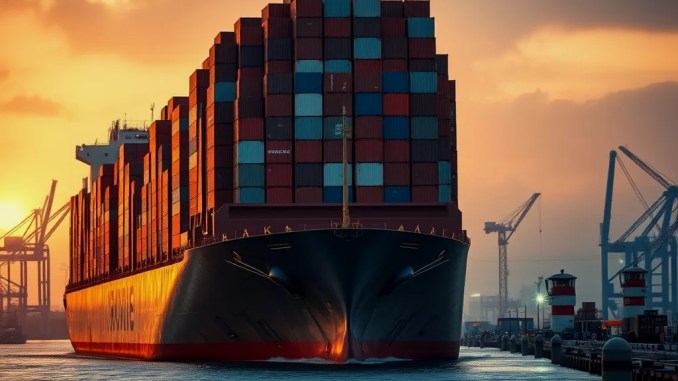
Japan’s International Sea Freight Prices Jumped 97.7% Year‑on‑Year in September 2026
Japan’s index of international sea freight prices rose to 315.9 in September 2026, up 97.7% from a year earlier and 16% from the prior month The Bank of Japan released the data on 27 October. That sharp rise reflects a concentrated move in the specific price component that tracks international maritime transport services purchased by Japanese firms.
How much did prices change month-to-month and year-to-year?
On a monthly basis, the sea freight price index climbed 16% from August to September, moving from 272.3 to 315.9. Year‑on‑year, the index accelerated from a 74.6% rise in August to a 97.7% rise in September — a one‑month jump of 23.1 percentage points. These figures describe change within the BOJ’s international sea freight price category rather than a uniform global move across all carriers or trade lanes.
What are the primary drivers of the spike?
Three principal factors explain the surge.
1) Short-term geopolitical risk in the Middle East. Heightened tension raised spot freight market volatility and pushed investors and carriers to price in route disruptions and security premiums for certain voyages.
2) Rising fuel costs. Bunker fuel and crude price movements feed directly into carriers’ operating costs. When fuel costs climb, shipping lines increase freight rates or reroute services to mitigate delays and fuel burn, raising effective transported-cost per container.
3) Defeat a weaker. Freight and energy contracts often price in dollars. As the yen weakens, Japan’s import bill for freight and fuel rises in JPY terms, amplifying the reported domestic price change even if USD‑denominated freight rates remain steady.
How this affects Japanese companies’ service purchase costs
Service producer prices for September rose 3.7% year‑on‑year, and excluding international transport the increase falls to 2.9%. That gap implies that international transport costs contributed materially to the overall rise in service input costs for firms. In practice, firms that import components or export finished goods face immediate cost pressure: logistics invoices denominated in foreign currency become costlier in yen, and higher freight rates translate into tighter margins or higher pass‑through to customers.
Which transport segments also rose?
Other transport categories showed notable gains in September, signaling broad logistic cost pressure rather than a sea‑only phenomenon:
– International air cargo: Prices rose 33.5% year‑on‑year, reflecting constrained belly capacity and higher fuel costs.
– Coastal and inland waterway freight: Prices rose 8.1% year‑on‑year, indicating domestic shipping also absorbed cost increases.
These movements suggest both international and domestic logistics channels are contributing to higher trade costs for businesses.
Will central bank policy respond to service cost increases?
The BOJ monitors producer service prices as part of its inflation assessment. Service producer price gains weigh on firms’ cost structures and factors into the extent to which companies can raise selling prices. With basic inflation measures rising — core indicators climbed to 3.2% year‑on‑year in September — the BOJ is expected to account for persistent input‑cost pressure, such as wage gains and transport, in its policy deliberations at the upcoming meeting.
Practical implications for importers, exporters and supply chains
Importers should run scenario analysis across three variables: freight rate trajectories, fuel price paths, and JPY exchange-rate moves. Example steps:
Step 1: Map current freight contracts and identify exposure where rates reset monthly or spot‑link to index values.
Step 2: Hedge currency exposure for expected freight and fuel invoices or negotiate dollar‑denominated caps with carriers where possible.
Step 3: Explore modal or sourcing alternatives — shift some flows to coastal feedering, consolidate shipments, or increase inventory buffer at major nodes to smooth short-term spot volatility.
Exporters should evaluate whether higher outbound logistics costs can be recovered through price adjustments or absorbed via operational efficiency gains. Contract renegotiation and differentiated pricing by region or channel can limit margin erosion.
How representative is Japan’s 97.7% figure for global shipping costs?
That figure reflects the BOJ’s domestic measurement of the international sea freight component and is not an automatic proxy for every lane or carrier. Global rates vary by route, vessel type, and contract terms. Still, a near‑doubling in the BOJ index signals material upward pressure in freight costs that can echo through regional supply chains and raise global trade costs where Japanese demand and contracts influence markets.
Which indicators to watch next
Track the following to anticipate further moves in logistics costs:
– Monthly BOJ service producer price releases for persistence in the international transport component.
– Bunker fuel price trends and crude oil futures as input‑cost drivers for liners.
– JPY/USD exchange-rate dynamics, which translate dollar‑priced freight into yen costs for Japanese firms.
– Spot container indices and regional freight indexes for lane‑specific developments rather than aggregate signals.
Bottom line
Japan’s reported 97.7% year‑on‑year rise in international sea freight prices in September 2026 reflects a concentrated jump within the BOJ’s measured component driven by Middle East risk, rising fuel prices and a weaker yen. The move materially lifts service producer costs and raises trade cost risks for firms; importers and exporters should reassess hedging, contracting and modal strategies to manage near‑term volatility.









Be the first to comment