
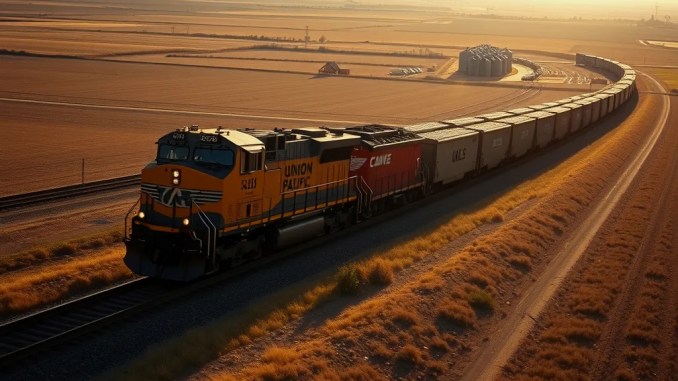
Fuel surcharge boosts third-quarter revenue while pressure on costs grows
Union Pacific reported a 15% year-over-year rise in operating revenue to $7.2 billion for Q3 2026. The company collected roughly twice the fuel surcharge revenue compared with the year-ago quarter, and higher freight volumes and pricing also supported top-line growth. Net income rose 16% to $2.1 billion and diluted EPS climbed 16% to $3.49. Excluding acquisition-related charges, adjusted EPS increased 15% to $3.53.
How much did fuel surcharges contribute and why
Fuel surcharge program revenue jumped from $602 million in Q3 2025 to $1.2 billion in Q3 2026. Two drivers explain the surge: higher diesel prices and increased tonnage. Diesel averaged $4.21 per gallon for locomotives in Q3 — a 64% increase from $2.56 in the previous-year quarter — which directly expanded surcharge receipts. When you remove fuel surcharges, freight revenue still rose 6%, showing that base pricing and volume gains also moved the needle.
Operating ratio moves and the net effect of fuel costs
Despite fuel’s negative impact, the reported operating ratio modestly improved to 59.1% (down 0.1 point). Higher fuel prices worsened the operating ratio by about 140 basis points, but volume growth, pricing gains, efficiency improvements and lower acquisition-related expenses offset much of that headwind. Excluding acquisition charges, the operating ratio stood at 58.8% (up 0.3 point). The company declared $22 million of acquisition-related costs in Q3 2026 versus $41 million in the previous-year quarter.
Detailed revenue composition and quarter-over-quarter trend
Total freight revenue, driven by higher surcharges, wagonload increases and pricing, reached approximately $6.8 billion (a 15% year-over-year rise). The quarter-by-quarter operating revenue sequence for 2026 was $6.217 billion in Q1, $6.864 billion in Q2 and $7.197 billion in Q3, while fuel expense rose from $643 million (Q1) to $938 million (Q2) and $1.04 billion (Q3). These sequential trends show consistent revenue growth but also sharply rising fuel expense that compresses margins if surcharges and pricing cannot fully offset the cost.
Which business segments led growth and by how much
Intermodal led the gains: container and trailer shipments climbed 11% year-over-year to 956,000 units and intermodal revenue jumped 27% to $1.517 billion. Industrial carloads rose 6% to 606,000 units, producing $2.509 billion in revenue (up 14%), helped by an 8% lift in metal and mineral shipments. Automotive carloads increased 2% to 202,000 units and automotive revenue grew 11% to $671 million. Bulk volumes held roughly steady at 529,000 carloads: grain rose 5% while coal and renewable-related shipments fell 3%, affected by lower natural gas prices and elevated plant inventories.
Operational improvements that sustained performance
Operations showed measurable efficiency gains: average miles per car per day rose 1% to 228; terminal dwell declined 2% to 19.9 hours; and average train length increased 2% to 9,969 feet. Labor productivity improved — car-mile per employee per day rose 5% to 1,219 — while average headcount modestly fell 1% to 28,540. Fuel consumption per thousand gross ton-miles improved 2% to 1.034 gallons, indicating better fuel efficiency even as fuel prices increased.
Customer service metrics and where the company fell short
Service scores softened: the intermodal service performance index dropped from 98% a year earlier to 92%, and the manifest index fell from 100% to 93%. Both indices were at 95% in Q2 2026. Union Pacific attributes part of the change to comparing performance to a rolling benchmark constructed from the best monthly results over the past three years; Despite the decline, management stated the company continues to meet customer commitments overall.
Comparing with Norfolk Southern’s Q3 release
Norfolk Southern reported a 14% year-over-year increase in railroad operating revenues to $3.5 billion the same quarter, calling it a quarterly revenue record. Volume rose about 3% and fuel surcharges added roughly eight percentage points of growth. Unlike Union Pacific, Norfolk Southern’s operating ratio widened from 64.6% to 67.4% year-over-year; adjusted operating ratio increased by 2.1 points to 65.4%.
Capital plan and acquisition timeline
Union Pacific raised its 2026 capital plan to about $3.5 billion from a prior $3.3 billion outlook. The company maintains guidance for low-single-digit EPS growth on a per-share basis, while noting elevated fuel costs remain a drag on reported operating ratio. On the proposed acquisition of Norfolk Southern, regulatory review timelines set by the Surface Transportation Board require public comments by November 18, 2026, and final summaries by May 28, 2027. A final decision is expected within 90 days after the application record closes.
What this means for shippers and investors
Shippers: expect higher fuel-related surcharge tiers while the network prioritizes longer trains and improved dwell times to preserve capacity and reliability Industries tied to energy markets (bulk coal, renewables) should watch demand volatility; grain and intermodal customers may see more stable uplift. Investors: revenue growth remains robust, but rising fuel expense introduces margin sensitivity; monitor spread between surcharge recoveries and actual fuel burn, plus any changes in service metrics that could affect long-term contract negotiations.
Quick reference figures and indicators
Key Q3 2026 figures: operating revenue $7.197B (+15% YoY); freight revenue ~ $6.813B (+15% YoY); fuel surcharge revenue $1.2B (vs $602M prior year); net income $2.1B (+16% YoY); diluted EPS $3.49 (+16% YoY); adjusted EPS $3.53 (+15% YoY); operating ratio 59.1% (reported), 58.8% (ex-acquisition charges); capital plan ~ $3.5B for 2026.
Operational highlights: average miles/car/day 228; terminal dwell 19.9 hours; avg train length 9,969 feet; car-miles per employee/day 1,219; fuel consumption 1,034 gal per 1,000 GTM.







Be the first to comment