
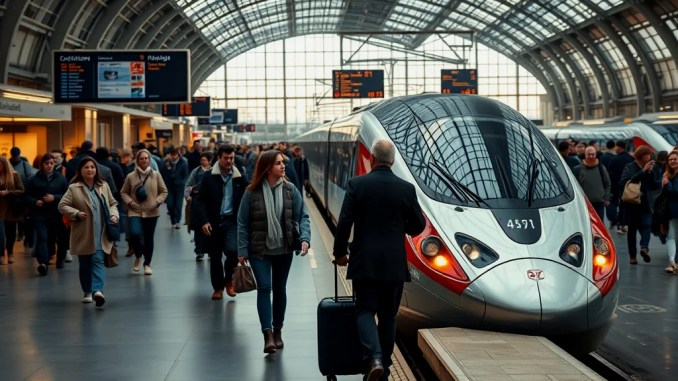
EU rail passenger traffic reached an all-time high in 2025
Railway operators across the European Union reported 457 billion passenger‑kilometers in 2025, the most since Eurostat began collecting comparable data in 2004. That volume represents a 2.6% increase on 2024 and stands 14.2% above the 2019 pre-pandemic level. Operators in Germany and France together accounted for roughly half of the EU total, underlining the concentration of long‑distance and suburban rail use in those markets.
Why growth slowed after a strong recovery
Recovery after the pandemic has continued but with decelerating momentum. The year started strongly—Q1 2025 showed a 5.3% year‑on‑year rise in passenger‑kilometers—but growth tapered sharply through the spring and summer. Q2 expanded by only 0.5% and Q3 by 0.3%, before Q4 rebounded to 2.7%. The annual 2.6% gain therefore reflects early‑year strength counterbalanced by mid‑year weakness.
This pattern reflects two concrete dynamics: (1) demand recapture following major service restorations and regained traveler confidence in 2021–2024, and (2) an emerging ceiling in discretionary and business travel as remote work and changed travel patterns persist. Network capacity recovered faster than some demand segments, creating short periods of underutilization that pulled growth rates down.
Passenger‑kilometres versus train‑kilometres: what each metric tells you
Passenger‑kilometres measure one passenger carried one kilometer and therefore capture how many people travel and how far. Train‑kilometres measure a train moving one kilometer and reflect schedule density and service provision. In 2025 EU passenger trains covered 3,125 million train‑kilometres, up 1.6% from 2024 and 7% from 2019—showing operators restored and even expanded service in some corridors even as passenger intensity per train varied.
Which countries drove the 2025 totals?
Germany led with 111.8 billion passenger‑kilometres, followed closely by France at 110.6 billion. Italy recorded 55.6 billion, Spain 38.3 billion and Poland 30.6 billion. Among large markets only Italy saw a slight decline versus 2024; Poland posted the strongest gain (+8.6%) among the five largest markets.
Countries with standout growth or decline and why
Portugal registered the highest percentage jump in 2025 at +25.7%, driven by a combination of timetable improvements, promotional fares and successful regional service rollouts that converted car trips into rail trips on high‑potential corridors. Ireland rose 13.1%, reflecting increased intercity demand and capacity additions. Conversely, Estonia (‑10.9%) and Romania (‑10.4%) fell, largely because of network maintenance interruptions and subsidized fare policy shifts that temporarily depressed measured passenger‑kilometres.
Per‑capita use and short‑trip patterns
Measured per person, Hungary led the EU at 1,692 passenger‑kilometres per inhabitant—indicative of a mix of frequent regional commuting and longer intercity usage. France (1,606) and Austria (1,588) followed. Countries with the lowest per‑capita figures—Greece (69), Lithuania (164) and Bulgaria (226)—reflect sparser networks and greater reliance on road transport for intercity trips. Luxembourg showed high trip frequency (46.1 trips per inhabitant) but very short average trip lengths (about 16 km), demonstrating how small dense states can produce high trip counts with modest passenger‑kilometres.
Modal share shift: rail’s increasing slice of the EU travel market
Rail’s share of total EU passenger‑kilometres rose to 7.5% in 2024, a 0.3 percentage point gain on 2023 and the first time since 2014 that rail overtook the combined share of coaches and trolleybuses. Cars still dominate at 69.2%, and aviation accounted for 15.8%. The increase for rail reflects both recovered long‑distance travel and policy‑driven shifts—tariff incentives, improved cross‑border services and targeted investments in rail corridors.
Concrete levers that boosted ridership in high‑growth markets
Successful measures that translated into measurable gains in 2025 include:
– Timetable densification and targeted rolling‑stock deployment: Adding peak services on regional and commuter corridors reduced crowding and increased trip frequency, drawing back commuting passengers.
– Promotional pricing and integrated ticketing: Time‑limited fare offers and simplified city‑to‑city ticket bundles raised trial rates among leisure travelers and weekend visitors.
– Infrastructure works completed on key corridors: Shorter journey times on flagship routes converted modal share from air and car, particularly where rail reached or beat two‑to‑three hour trip windows.
Implications for operators, planners and travellers
Operators should prioritise matching capacity to observed demand patterns: retain successful frequency increases on corridors showing sustained occupancy, and surplus shift capacity toward under‑served routes with latent demand. Planners can accelerate corridor upgrades that provide the greatest diversion from air and car (2–4 hour corridors) and couple infrastructure investment with fare and marketing strategies to convert travellers.
For travellers, more frequent services and improved offers translate into better alternatives for short business trips and intercity leisure travel. Monitoring occupancy and fare elasticity at route level will indicate where continued investment or marketing will be most effective.
Key figures at a glance
– EU total passenger‑kilometers (2025): 457 billion (+2.6% vs 2024)
– Train‑kilometers (2025): 3,125 million (+1.6% vs 2024)
– Leading countries: Germany 111.8bn, France 110.6bn, Italy 55.6bn, Spain 38.3bn, Poland 30.6bn
– Fastest national growth (2025): Portugal +25.7%, Ireland +13.1%, Poland +8.6%
How to read future updates and expected trends
Eurostat will issue the next full passenger rail update in October 2027. Expect future releases to reflect continued structural change: slow but steady increases in off-peak leisure travel, uneven recovery of business travel, and a growing share of trips diverted from short-haul aviation where rail competes on time and price. Watch for the combined effect of rolling‑stock deliveries, timetable changes and national fare strategies—those operational levers produce the clearest near‑term ridership responses.







Be the first to comment