
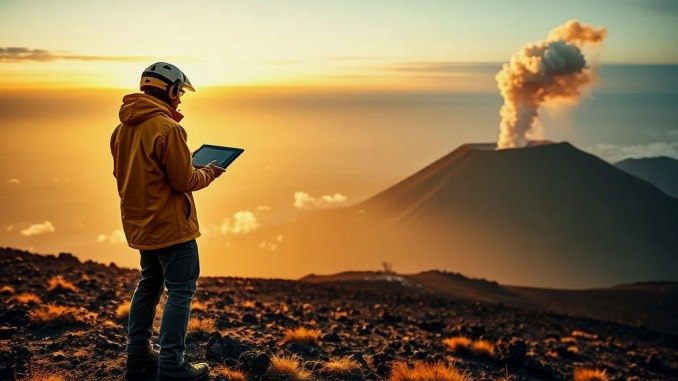
Laach volcano records rising CO₂ bubbles and deep microquakes
Researchers detected continuous carbon dioxide seepage from the lakebed on the southeast shore of Laach Lake, accompanied by a pattern of low-to-moderate earthquakes. Field teams measured CO₂ bubbling sites directly using gas flux chambers and underwater cameras, noting localized columns of bubbles that persisted during repeated visits. Seismic stations recorded a swarm of microearthquakes with focal depths between 10 and 40 kilometers; the focal depths have shown a subtle upward migration over months, a signal commonly interpreted as potential magma ascent in volcanic systems.
What the recorded signals mean and how scientists interpret them
CO₂ emissions from lakebeds and upward-moving microseismicity together form a coherent picture of increased subsurface gas migration. Gas release can originate from magmatic degassing, from heating and pressurizing of deep hydrothermal fluids, or from tectonic stress changes that open pathways. Scientists combine gas composition (CO₂/He ratios), seismic locations, and ground deformation to discriminate these causes. For Laach, preliminary gas analyzes show elevated CO₂ with mantle-like helium signatures, which increases the likelihood of magmatic contributions rather than only shallow biogenic sources.
Potential regional impacts if a large eruption occurs
A major explosive event at Laach could affect broad swathes of Central Europe. Historical data show the last Laach eruption ~13,000 years ago ejected tens of cubic kilometers of tephra that reached from the Rhine valley into Scandinavia and Italy. Modeling of a comparable event indicates:
- Widespread ash fall across the Rhineland and into parts of Germany, Belgium and the Netherlands within hours to days, disrupting transport and infrastructure.
- Thick tephra deposits in river valleys could block channels, increasing flood risk and altering local drainage.
- Stratospheric injection of ash and sulfur-bearing gases could lower regional surface temperatures by a measurable amount for months to while acid deposition can harm soils and freshwater systems.
Which communities face the highest immediate risk?
Koblenz and Bonn rank among the most exposed urban centers in available hazard maps.Municipal emergency planners should review ashfall projections, identify critical infrastructure (water treatment, hospitals, power stations) within predicted ash corridors, and determine evacuation or sheltering strategies for densely populated neighborhoods. Local authorities can use layered hazard maps combining ash thickness, lahar pathways, and wind-climatology to prioritize actions.
How monitoring would detect escalation and what triggers response levels
Volcanic response is staged using multiple measurable thresholds rather than a single indicator.Key triggers include: sustained increase in shallow seismicity and upward migration of hypocenters; rising SO₂ and CO₂ fluxes with magmatic signature; measurable ground uplift exceeding background; new or expanding fumaroles or lake gas emissions. Authorities typically progress from increased alert to evacuation if several of these indicators accelerate rapidly. Operational monitoring should include continuous broadband seismometers, InSAR and GPS for ground deformation, continuous gas sensors on the lake and soils, and periodic airborne or satellite thermal surveys.
Practical protective actions for residents and infrastructure managers
Preparedness reduces immediate harms from ash and gas even when the eruption timing is uncertain.Key actions include: maintaining N95 or FFP2 masks and eyewear for ash protection; sealing HVAC intakes and windows to limit ash ingress; pre-positioning heavy equipment and pumps to clear ash from critical drains and river inlets; ensuring backup power and filtered water supplies for hospitals and water plants. For agriculture, short-term covers for sensitive crops and removal plans for ash-contaminated feed can markedly reduce losses.
Data-driven examples and step-by-step monitoring workflow
An effective monitoring workflow combines continuous and campaign-style measurements:
Step 1: Maintain 24/7 seismic network and automated event location with manual review of swarms.
Step 2: Install continuous gas sensors at shoreline and deploy floating chambers to quantify fluxes; sample gases weekly for CO₂/He/SO₂ ratios.
Step 3: Perform weekly InSAR updates and GPS time series to detect centimeter-scale uplift.
Step 4: Run ash-dispersion models with current meteorology whenever seismic/gas thresholds are exceeded.
Step 5: Communicate graded risk levels to emergency managers and the public with clear protective actions per level.
Scientific uncertainties and why immediate eruption is not certain
Recorded activity increases the need for vigilance but does not prove imminent eruption.Many volcanoes display episodic gas emissions and microseismicity for years without erupting. Critical uncertainties include the volume and depth of any potential magma intrusion, the permeability of intervening rock, and whether gas release will relieve pressure without explosive fragmentation. Continuous multidisciplinary analysis narrows these uncertainties over time.
What to watch for next — concise checklist
Watch for accelerating signals across multiple domains:
- Clear upward trend in earthquake rates and shallowing hypocenters.
- Rapid rise in magmatic gas ratios (CO₂/He, SO₂ increases).
- Persistent centimetre-scale uplift centered at Laach.
- New vents, increased lake bubbling, or sudden hot spots on thermal surveys.
How authorities and scientists can improve resilience community
Investing in sustained monitoring, public education, and infrastructure hardening reduces impacts.Actions with strong cost–benefit include expanding continuous gas and seismic arrays, creating pre-agreed ash removal contracts, and running realistic evacuation and continuity exercises with municipalities in the Rhine corridor.









Be the first to comment