

Apple’s Q4 2026 Performance Overview
Apple closed the quarter ending September 26, 2026, with $114.5 billion in net sales, a roughly 12% year-over-year increase. Net income rose to $30.7 billion and diluted EPS reached $2.10. These headline figures reflect simultaneous product-cycle strength and expanding recurring revenue from services.
How iPhone, Mac, and iPad Shaped the Quarter
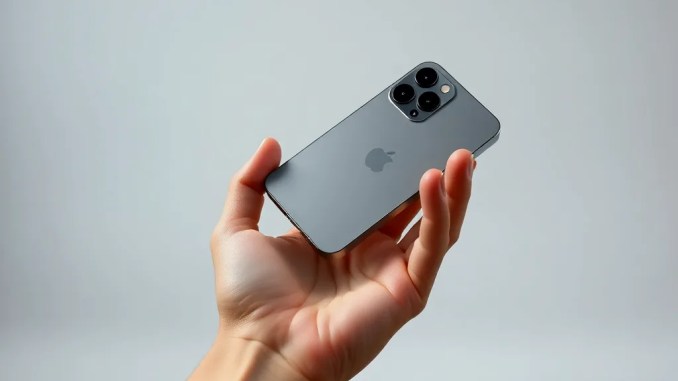
iPhone led product growth with $57.6 billion in revenue (up ~17.5% YoY). New-model demand concentrated purchases early in the cycle, and cross-selling into services (iCloud, AppleCare, App Store purchases) amplified average revenue per user. Mac revenue jumped to $10.8 billion (about +23.7% YoY), driven by corporate refresh cycles and sustained demand for higher-performance models used in hybrid work. iPad revenue declined to $6.2 billion (down ~10.4% YoY) as education & consumer segments faced slower upgrade cycles and stronger competition from value tablets.
Why Services Matter: Composition and Long-term Impact
Services rose to $31.6 billion for the quarter (around +10% YoY), fueled by subscription growth (Apple Music, Apple TV+, iCloud storage tiers), in-app purchases, and platform fees from the App Store. Services contribute higher gross margins and recurring cash flows that dampen hardware revenue volatility. Over multiple cycles, a larger services mix typically raises operating margin resilience and reduces sensitivity to single-product cycles.
Full Fiscal Year 2026: Numbers and Sector Commentary
For fiscal 2026, Apple reported $478.8 billion in net sales (≈+15% YoY) and $132.2 billion in net income (+18% YoY). Product-level annual figures included iPhone $254.1B, Mac $37.9B, iPad $27.9B, and Services $123.3B. These totals show a business shifting toward a two-pillar model: high-volume device sales plus high-margin recurring services.
Factors That Drove Growth This Year
Several distinct drivers combined to produce the year’s results: strong new-device designs that accelerated replacement cycles; ecosystem-led monetization that turned device buyers into service subscribers; targeted pricing and bundle strategies; operational improvements in supply chain that reduced cost-per-unit; and selective geographic recoveries where demand returned faster than peers. Currency translation and cost control also supported reported profitability.
Key Takeaways Investors Should Watch
Watch four indicators closely: 1) iPhone unit trends and ASP (average selling price) for signs of sustained premium demand; 2) Services monthly active users and ARPU (average revenue per user) to gauge recurring revenue momentum; 3) iPad refresh rates and education sales as an early indicator of recovery; 4) Gross margin mix between hardware and services, which drives net income sensitivity. Together these metrics signal whether growth is durable or cycle-driven.
Interpreting the Quarter: Risks and Opportunities
Risks include macro-driven demand weakness, foreign-exchange swings, and competitive pressure in tablets and lower-tier devices. Opportunities lie in bundling services with hardware, expanding enterprise and education footholds, and converting device buyers into multiple-service subscribers—each step increases customer lifetime revenue and margin.
Practical Actions for Investors and Product Strategists
Investors should monitor quarterly subscriber additions, services revenue per region, and gross margin trends rather than focusing only on headline sales. Product teams should prioritize: 1) initiatives that increase retention (eg, family/shared subscriptions), 2) seamless onboarding flows that convert device activation into paid trials, and 3) enterprise features that widen Mac adoption at scale. These targeted actions translate into steadier recurring revenue and improved valuation multiples.
Data Table: Quarter vs. Fiscal Year 2026 Results
Summary of key figures:
Quarter (ended Sep 26, 2026): Total Net Sales $114.5B; Net Income $30.7B; iPhone $57.6B; Mac $10.8B; iPad $6.2B; Services $31.6B; EPS $2.10.
Fiscal Year 2026: Total Net Sales $478.8B; Net Income $132.2B; iPhone $254.1B; Mac $37.9B; iPad $27.9B; Services $123.3B.
How to Read These Results Over the Next 12–24 Months
Expect quarter-to-quarter variation tied to product cycle timing. If Services maintain double-digit growth and iPhone demand holds at premium price points, overall revenue will show lower volatility. Monitor currency and macro indicators as external amplifiers of downside risk. In short, stronger services penetration reduces dependence on hardware refresh timing and smooths revenue trajectories.








Be the first to comment