
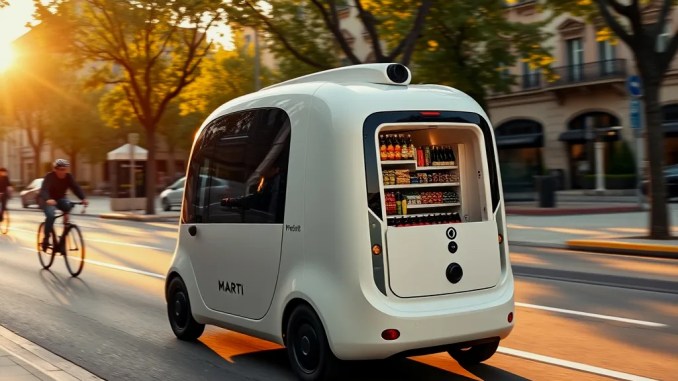
What is RoboMartı and how does it operate?
RoboMartı combines AI-driven autonomous vehicles with a shared-ride service model to move people efficiently in urban environments. Vehicles sense the environment with high-resolution cameras, lidar, and radar, fusion software builds a coherent scene, and decision systems select maneuvers in real time. A layered architecture separates perception, localization, planning, behavior selection and control so each layer can be validated independently and updated without halting the fleet.
Which sensors are used and why they matter
RoboMartı vehicles use a complementary sensor suite: cameras for color, text and lane detection; lidar for precise 3D geometry and obstacle contours; radar for velocity and range in adverse weather. This multimodal approach reduces single-sensor failure modes: lidar resolves shape where cameras misread lighting, radar provides reliable velocity when lidar reflections decrease, and cameras capture semantic cues (signs, signals, crosswalk paint) critical for lawful behavior.
Software architecture: perception, localization and decision flow
Perception pipelines run object detection, classification and multi-object tracking to produce consistent world models. A sensor-fusion localization module aligns live sensor data with HD maps and GNSS using probabilistic filters to keep vehicle pose within decimeter accuracy. The planning stack implements a two-stage pipeline: a global route planner that optimizes macro routing and a local planner that produces dynamically feasible trajectories respecting kinematics and traffic rules. A behavior planner evaluates rule-based and learned policies for right-of-way, yield, merging and passenger comfort, then hands off trajectories to low-level controllers that execute steering, throttle and braking commands with latency constraints under 50 ms.
How safety, testing and verification are enforced
Safety uses layered defenses: extensive scenario-based simulation, closed-course validation, staged public pilots and runtime safety monitors in production Simulators run millions of parameterized scenarios to exercise edge cases (sudden pedestrian darting, sensor occlusion, ambiguous intersections). Hardware-in-the-loop and shadow mode tests run on-city-equivalent data to verify real-time performance. Vehicles include independent safety subsystems: an emergency-stop actuator isolated from the main controller, a watchdog that triggers safe shutdown on software anomalies, and remote supervisory control for de-escalation. Continuous integration pipelines include formal tests, regression suites, and risk scoring per release; releases failing safety gates automatically rollback at fleet scale.
How the shared-ride model works in practice
The service matches ride requests to vehicles using dynamic matching and multi-stop route optimization. The dispatcher balances three KPIs: passenger wait time, in-vehicle travel time, and vehicle utilization. Algorithms cluster compatible pickups—same direction, compatible time windows—and compute detours that minimize aggregate cost rather than per-passenger shortest path. For example, grouping three riders heading along a corridor can reduce person-miles and average fare per rider while keeping individual detours under a configurable threshold (eg, +10 minutes). Surge pricing gates and local incentives align supply and demand in peak windows.
Regulatory landscape and urban planning integration
Deployment requires coordinated approvals: test permits, operational licenses and liability frameworks. Integrating with municipalities includes reserving curb space for pickups/dropoffs, allocating parking and charging infrastructure, and establishing data-sharing protocols for anonymous trip traces to support planning. City pilots should define performance metrics (congestion impact, equitable access, safety incidents) and an agreed escalation process for incidents. Co-designed geofencing enforces operational boundaries and allows gradual expansion guided by measured outcomes.
User experience: app flows, payments and in-vehicle safety
Design the rider app for fast task completion: request a ride in two taps, see ETA and projected stops, and receive continuous route updates. Support multiple payment modes (card, mobile wallets, corporate billing) and micropayments for very short trips. In-vehicle UX includes clear onboarding, visible emergency contact controls, optional interior cameras for incident review (subject to privacy rules), and accessible instructions for riders with disabilities. A post-ride rating loop combined with telemetry-driven anomaly detection helps identify service or safety regressions rapidly.
Commercial model: costs, revenue streams and sustainability
Model costs as fixed (vehicle acquisition, sensor suites, software R&D) and variable (energy, maintenance, insurance). Revenue streams include per-ride fares, subscription packages for frequent riders, corporate contracts for first/last-mile services, and advertising or data services that respect privacy. Shared routing increases seat-occupancy, which lowers per-passenger cost; simulations show occupancy gains from 1.2 to 2.0 riders/vehicle can reduce person-km cost by 30–45% depending on trip distribution. Electrification reduces operating cost per km and improves lifecycle emissions when charged from low-carbon grids.
Expected impacts in Turkey and illustrative scenarios
Short-term pilots can reduce inner-city vehicle counts by consolidating commuters on high-demand corridors. Example: On a dense arterial with 10,000 morning peak riders, achieving 15% mode shift to RoboMartı shared trips could cut peak vehicle entries by 8–12% depending on average vehicle occupancy and route overlap. Medium-term outcomes include better first/last-mile integration with mass transit, reduced demand for curbside parking, and new jobs in fleet operations and maintenance.
Key risks and practical mitigations
Primary risks include software defects, cyberattacks, legal uncertainty, and infrastructure mismatches. Mitigations: deploy defense-in-depth cybersecurity (segmentation, cryptographic authentication, over-the-air update validation), continuous verification with real-world telemetry, contractual insurance pools for unclear liability scenarios, and phased infrastructure investments (smart signals, V2X pilot corridors) to de-risk operations. Include human-in-the-loop fallback procedures during transition stages.
Step-by-step pilot implementation guide
1) Select target geography: choose corridors with predictable demand, supportive agencies and existing curb/charging capacity.
2) Engage stakeholders: secure agreements with transport authorities, local utilities and emergency services; define success metrics.
3) Validate technology: run focused simulations and closed-course trials for mapped geofenced areas.
4) Launch supervised pilots: operate with remote supervisors and limited live riders; collect dense telemetry and user feedback.
5) Iterate on operations: refine matching heuristics, geofences and safety policies using A/B experiments.
6) Scale responsibly: expand fleet and service area only after meeting safety, utilization and equity targets.
Conclusion: practical next steps and measurable objectives
Begin with a narrow, data-rich pilot that measures safety incidents per-million-km, average wait time, vehicle occupancy and equity of access. Use those metrics to iterate on autonomous stack maturity, dispatch algorithms and operational processes. Deliver near-term wins by integrating with park-and-ride and transit hubs, then scale network effects once the safety case, regulatory clarity and user acceptance alignment.







Be the first to comment